Difference between revisions of "Create an Excel Reporting Template"
(→This Use Case) |
(→The means to restrict) |
||
| (21 intermediate revisions by 2 users not shown) | |||
| Line 1: | Line 1: | ||
[[Category:How_To]] | [[Category:How_To]] | ||
| − | + | [[Category:How_To V11]] | |
=Overview= | =Overview= | ||
| − | + | An [[Excel Reporting Template]] (also sometimes called a Data Reporting Template) is a metadata driven Excel Form to enable [[Organisations_-_Data_Providers|Data Providers]] to easily report data.<br> | |
| − | |||
A Reporting Template definition is created in the Fusion Metadata Registry and describes the contents and layout of one Excel Workbook. Each workbook contains at least one worksheet which is backed by the Dataflow that the data collection is for. A workbook may contain multiple worksheets, enabling one Excel file to be used to submit data for multiple datasets. <br> | A Reporting Template definition is created in the Fusion Metadata Registry and describes the contents and layout of one Excel Workbook. Each workbook contains at least one worksheet which is backed by the Dataflow that the data collection is for. A workbook may contain multiple worksheets, enabling one Excel file to be used to submit data for multiple datasets. <br> | ||
| − | |||
The Registry provides both a web User Interface and web services to generate the Excel Workbook for a Reporting Template for a specific Data Provider. The contents of the Excel workbook are dynamically obtained based on who the Data Provider is. This enables a single data collection template to be set up for multiple data providers, where each provider's workbook contains only the worksheets, and data cells they need to report data for.<br> | The Registry provides both a web User Interface and web services to generate the Excel Workbook for a Reporting Template for a specific Data Provider. The contents of the Excel workbook are dynamically obtained based on who the Data Provider is. This enables a single data collection template to be set up for multiple data providers, where each provider's workbook contains only the worksheets, and data cells they need to report data for.<br> | ||
| − | |||
==This Use Case== | ==This Use Case== | ||
| Line 16: | Line 13: | ||
This example is a simple Template using the GUI and is for a scenario where the agency WB (World Bank) has a number of Data Providers (including one with the ID of GHA) who are reporting statistics against the Dataflow GCI (Global Competitive Index). The Data Provider GHA, is only permitted to report statistical data for Ghana.<br> | This example is a simple Template using the GUI and is for a scenario where the agency WB (World Bank) has a number of Data Providers (including one with the ID of GHA) who are reporting statistics against the Dataflow GCI (Global Competitive Index). The Data Provider GHA, is only permitted to report statistical data for Ghana.<br> | ||
| − | + | This example shows how the Registry can be used to create an Excel Template for the specific Data Provider. Once the end result is '''Generated''', it could be issued to the Data Provider for completion. Once the Excel spreadsheet has been completed by the Data Provider, Fusion Metadata Registry can be used to validate the data via the [[Convert_data_between_SDMX_formats|'''Convert''']] data page. | |
| − | This example shows how the Registry can be used to create an Excel Template for the specific Data Provider. Once the end result is '''Generated''', it could be issued to the Data Provider for completion. Once the Excel spreadsheet has been completed by the Data Provider, Fusion Metadata Registry can be used to validate the data via the [[Convert_data_between_SDMX_formats'''Convert''' data page | ||
=Creating the Template= | =Creating the Template= | ||
| Line 27: | Line 23: | ||
| − | [[File:RT1.PNG|1000px]]<br> | + | [[File:RT1.PNG|Data Structure|Data Structure|1000px]]<br> |
===Dataflow=== | ===Dataflow=== | ||
| − | [[File:RT2.PNG|1000px]]<br> | + | [[File:RT2.PNG|Dataflow|Dataflow|1000px]]<br> |
===Data Provider and Provision Agreement=== | ===Data Provider and Provision Agreement=== | ||
| − | [[File:RT3.PNG|1000px]]<br> | + | [[File:RT3.PNG|Data Provider and Provision Agreement|1000px]]<br> |
| + | |||
| + | Note, in Version 11, the Data Provider button is located lower down the page. | ||
| + | |||
| + | [[File:Data Provider-button.png|Data Provider button|950px]]<br> | ||
===The means to restrict=== | ===The means to restrict=== | ||
| Line 44: | Line 44: | ||
| − | [[File:RT9.PNG|1000px]]<br> | + | [[File:RT9.PNG|Checking cross-references|1000px]]<br> |
| − | Note that the '''Cross Reference''' is a link | + | Note that the '''Cross Reference''' is a link. If I click, I will be taken to the Concept Scheme, and I can see a Cross Reference to a Codelist. |
| + | Note, in Version 11, the Cross References function has changed. This is now available using the References button. | ||
| − | [[File:RT10.PNG|1000px]]<br> | + | [[File:References.png|References button|1000px]]<br> |
| + | |||
| + | To learn more about the [[Explore_Structure_References| Structure Reference feature, please click here]]. | ||
| + | |||
| + | |||
| + | [[File:RT10.PNG|Linked Concept Scheme|1000px]]<br> | ||
Again a link. If I click the link and '''View''' the codelist, I can enter the search term Ghana, to find the code that is used. '''GHA'''. | Again a link. If I click the link and '''View''' the codelist, I can enter the search term Ghana, to find the code that is used. '''GHA'''. | ||
| − | [[File:RT11.PNG|1000px]]<br> | + | [[File:RT11.PNG|Finding the code for Ghana|1000px]]<br> |
I now have everything I need to move to the next step. | I now have everything I need to move to the next step. | ||
| Line 60: | Line 66: | ||
==Step 2 - Create Reporting Constraint== | ==Step 2 - Create Reporting Constraint== | ||
| − | From the '''Data''' menu, select '''Reporting Constraints''', then use the '''Maintenance''' button to select Create '''New Cube Region Constraint'''. | + | From the '''Data''' menu, select [[Content_Constraints|'''Reporting Constraints''']], then use the '''Maintenance''' button to select Create '''New Cube Region Constraint'''. |
| − | [[File:RT4.PNG|300px]]<br> | + | [[File:RT4.PNG|Create option|300px]]<br> |
The Reporting Constraint Wizard will open and Step 1 is completed with the basic details as shown below. | The Reporting Constraint Wizard will open and Step 1 is completed with the basic details as shown below. | ||
| − | [[File:RT5.PNG| | + | [[File:RT5.PNG|Create a new Cube Constraint - Step 1|450px]]<br> |
| − | |||
Step 2 allows you to select a structure type, in this example it is the Data Provider who is to be constrained to only submit data for Ghana. | Step 2 allows you to select a structure type, in this example it is the Data Provider who is to be constrained to only submit data for Ghana. | ||
| − | [[File:RT6.PNG|1000px]]<br> | + | [[File:RT6.PNG|Create a new Cube Constraint - Step 2|1000px]]<br> |
| − | You will note that the Components of the underlying Data Structure are displayed and REF-AREA has been ticked. The codelist CL_WB_CGI_AREA contains all countries. The next step of the Wizard will allow us to define which Country. | + | You will note that the [[Component|Components]] of the underlying Data Structure are displayed and REF-AREA has been ticked. The codelist CL_WB_CGI_AREA contains all countries. The next step of the Wizard will allow us to define which Country. |
In Step 3, the Wizard allows you to define included values and in this example I have used the '''+Add New Value''' button to add the code '''GHA'''. | In Step 3, the Wizard allows you to define included values and in this example I have used the '''+Add New Value''' button to add the code '''GHA'''. | ||
| − | [[File:RT7.PNG|1000px]]<br> | + | [[File:RT7.PNG|Create a new Cube Constraint - Step 3|1000px]]<br> |
In Step 4, you can Exclude values but this is unnecessary in this example. | In Step 4, you can Exclude values but this is unnecessary in this example. | ||
| Line 90: | Line 95: | ||
| − | [[File:RT12.PNG| | + | [[File:RT12.PNG|Create a new Template - Step 1|450px]]<br> |
===Step 2 - Excel Worksheets=== | ===Step 2 - Excel Worksheets=== | ||
| Line 96: | Line 101: | ||
| − | [[File:RT16.PNG|1000px]]<br> | + | [[File:RT16.PNG|Create a new Template - Step 2|1000px]]<br> |
In this example, an Instruction worksheet is created as shown in the image below | In this example, an Instruction worksheet is created as shown in the image below | ||
| − | [[File:RT13.PNG|1000px]]<br> | + | [[File:RT13.PNG|Create a new Template - Step 3|1000px]]<br> |
| Line 110: | Line 115: | ||
Only authenticated users are able to Generate a Template so this example assumes that the Template is to be generated and emailed to the person responsible for completing it. | Only authenticated users are able to Generate a Template so this example assumes that the Template is to be generated and emailed to the person responsible for completing it. | ||
| + | '''TIP:''' If the button is inactive, check that the Provision Agreement is in place. | ||
| + | |||
| + | |||
| + | [[File:RT17.PNG|Generate Template button|1000px]]<br> | ||
| − | |||
| + | [[File:RT14.PNG|Generate Excel Form|400px]]<br> | ||
| − | |||
You will note that the Data Provider GHA has been selected, this means that the Constraint attached to the Provision Agreement will be used. The Frequency selected is Annual, so to to report for the whole of 2019, that year is placed on both the From and To dates. Click '''Generate''' when done. | You will note that the Data Provider GHA has been selected, this means that the Constraint attached to the Provision Agreement will be used. The Frequency selected is Annual, so to to report for the whole of 2019, that year is placed on both the From and To dates. Click '''Generate''' when done. | ||
| Line 121: | Line 129: | ||
| − | [[File:RT15.PNG|1000px]]<br> | + | [[File:RT15.PNG|The Excel workbook|1000px]]<br> |
Latest revision as of 03:26, 28 March 2024
Overview
An Excel Reporting Template (also sometimes called a Data Reporting Template) is a metadata driven Excel Form to enable Data Providers to easily report data.
A Reporting Template definition is created in the Fusion Metadata Registry and describes the contents and layout of one Excel Workbook. Each workbook contains at least one worksheet which is backed by the Dataflow that the data collection is for. A workbook may contain multiple worksheets, enabling one Excel file to be used to submit data for multiple datasets.
The Registry provides both a web User Interface and web services to generate the Excel Workbook for a Reporting Template for a specific Data Provider. The contents of the Excel workbook are dynamically obtained based on who the Data Provider is. This enables a single data collection template to be set up for multiple data providers, where each provider's workbook contains only the worksheets, and data cells they need to report data for.
This Use Case
This example is a simple Template using the GUI and is for a scenario where the agency WB (World Bank) has a number of Data Providers (including one with the ID of GHA) who are reporting statistics against the Dataflow GCI (Global Competitive Index). The Data Provider GHA, is only permitted to report statistical data for Ghana.
This example shows how the Registry can be used to create an Excel Template for the specific Data Provider. Once the end result is Generated, it could be issued to the Data Provider for completion. Once the Excel spreadsheet has been completed by the Data Provider, Fusion Metadata Registry can be used to validate the data via the Convert data page.
Creating the Template
Step 1 - Check all the elements are in place
Data Structure
Dataflow
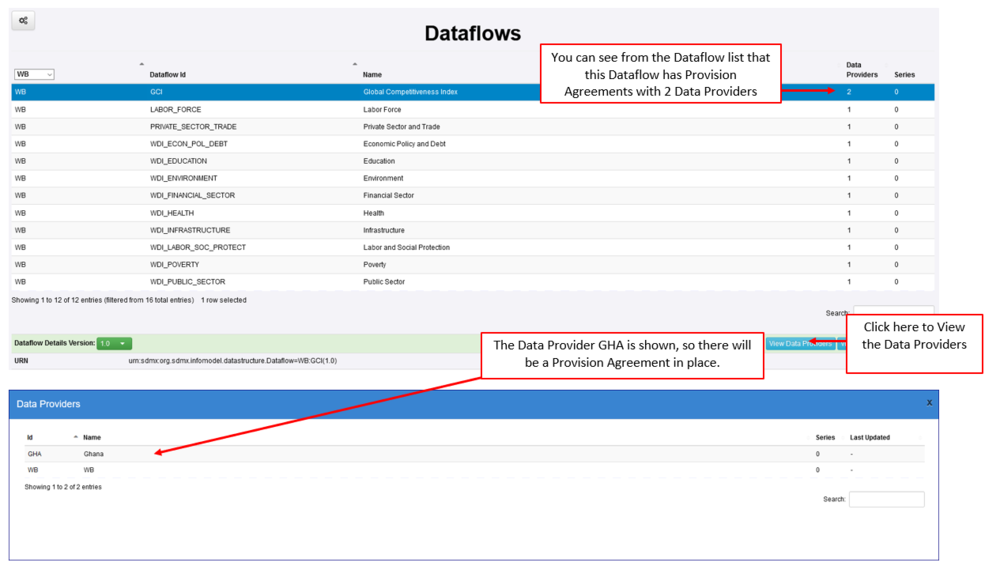
Data Provider and Provision Agreement
Note, in Version 11, the Data Provider button is located lower down the page.
The means to restrict
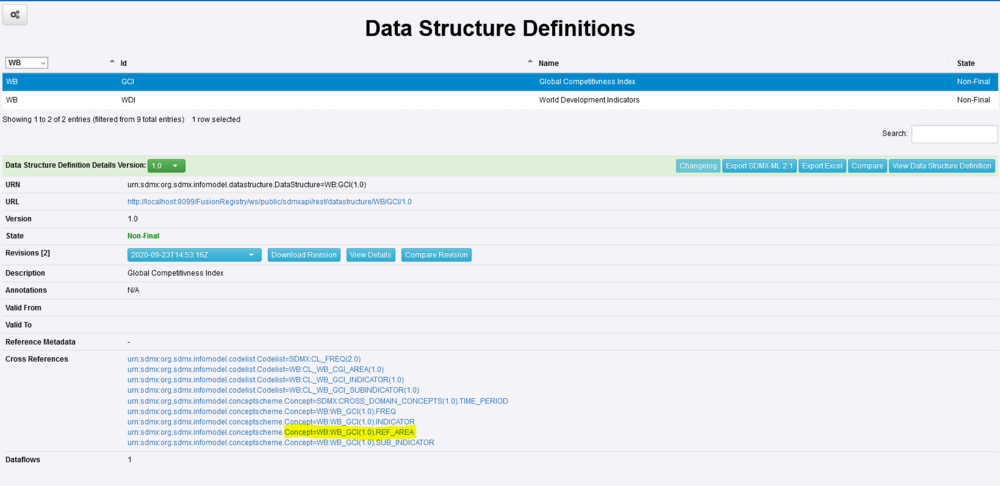
In this example I am going to use the AREA code method to restrict using the code GH (the code for Ghana). If I check the Data Structure, I can see what other structures have been used. In this example I am looking at the Concept as highlighted in the image below.
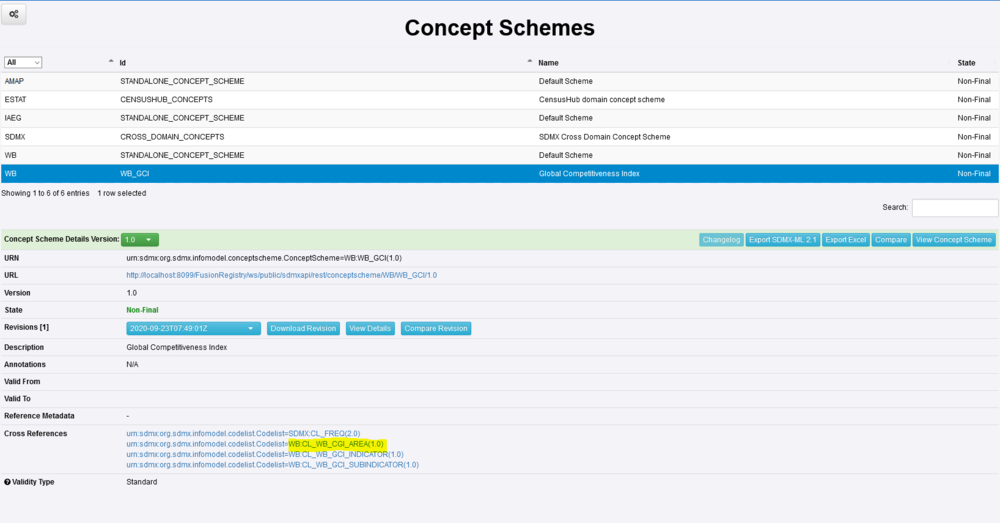
Note that the Cross Reference is a link. If I click, I will be taken to the Concept Scheme, and I can see a Cross Reference to a Codelist.
Note, in Version 11, the Cross References function has changed. This is now available using the References button.
To learn more about the Structure Reference feature, please click here.
Again a link. If I click the link and View the codelist, I can enter the search term Ghana, to find the code that is used. GHA.
I now have everything I need to move to the next step.
Step 2 - Create Reporting Constraint
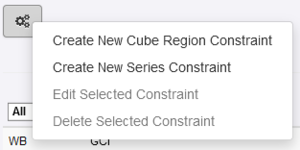
From the Data menu, select Reporting Constraints, then use the Maintenance button to select Create New Cube Region Constraint.
The Reporting Constraint Wizard will open and Step 1 is completed with the basic details as shown below.
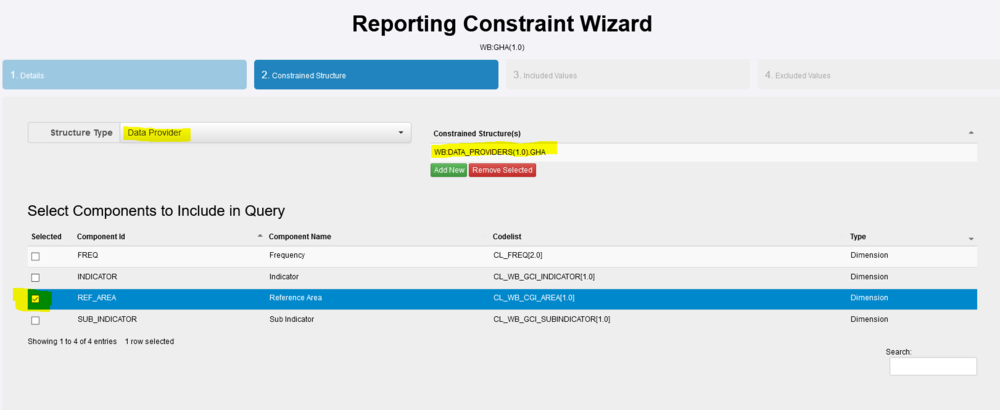
Step 2 allows you to select a structure type, in this example it is the Data Provider who is to be constrained to only submit data for Ghana.
You will note that the Components of the underlying Data Structure are displayed and REF-AREA has been ticked. The codelist CL_WB_CGI_AREA contains all countries. The next step of the Wizard will allow us to define which Country.
In Step 3, the Wizard allows you to define included values and in this example I have used the +Add New Value button to add the code GHA.
In Step 4, you can Exclude values but this is unnecessary in this example.
Creating the Reporting Template
Once all the relevant steps have been completed, the actual Reporting Template can be created using the Wizard.
Step 1 - High Level Details
Step 2 - Excel Worksheets
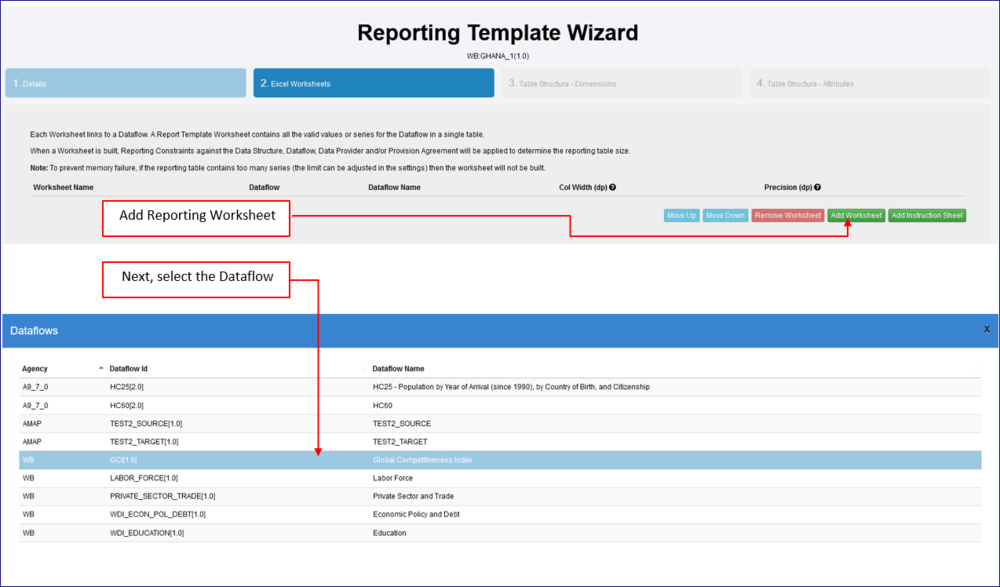
Follow the instructions shown in the image below to add the first worksheet which will be used to report the observations.
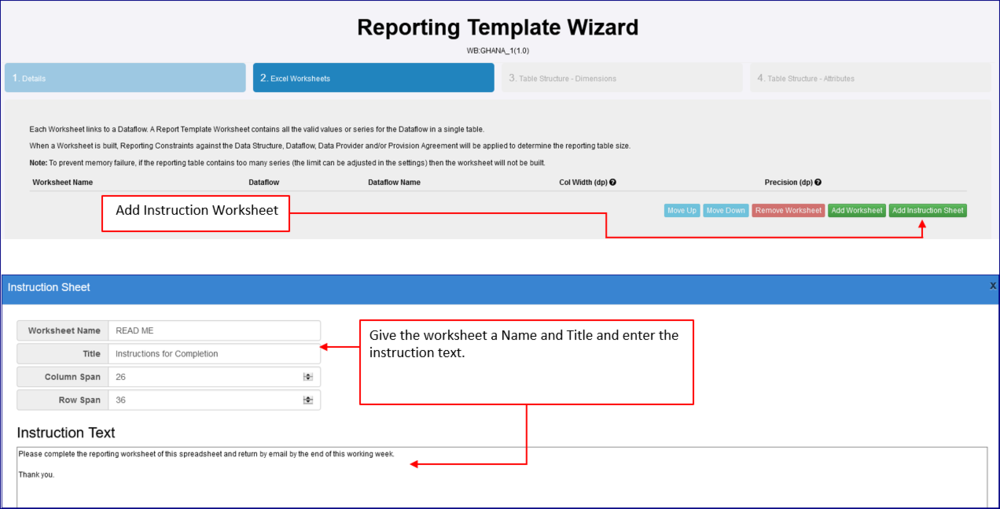
In this example, an Instruction worksheet is created as shown in the image below
As this is a simple example, Steps 3 and 4 can be skipped so click Finish to save.
Generate the Template
Only authenticated users are able to Generate a Template so this example assumes that the Template is to be generated and emailed to the person responsible for completing it.
TIP: If the button is inactive, check that the Provision Agreement is in place.
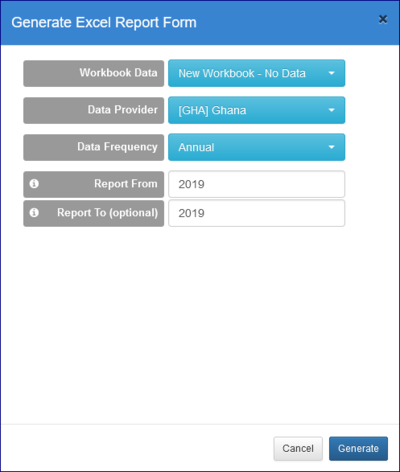
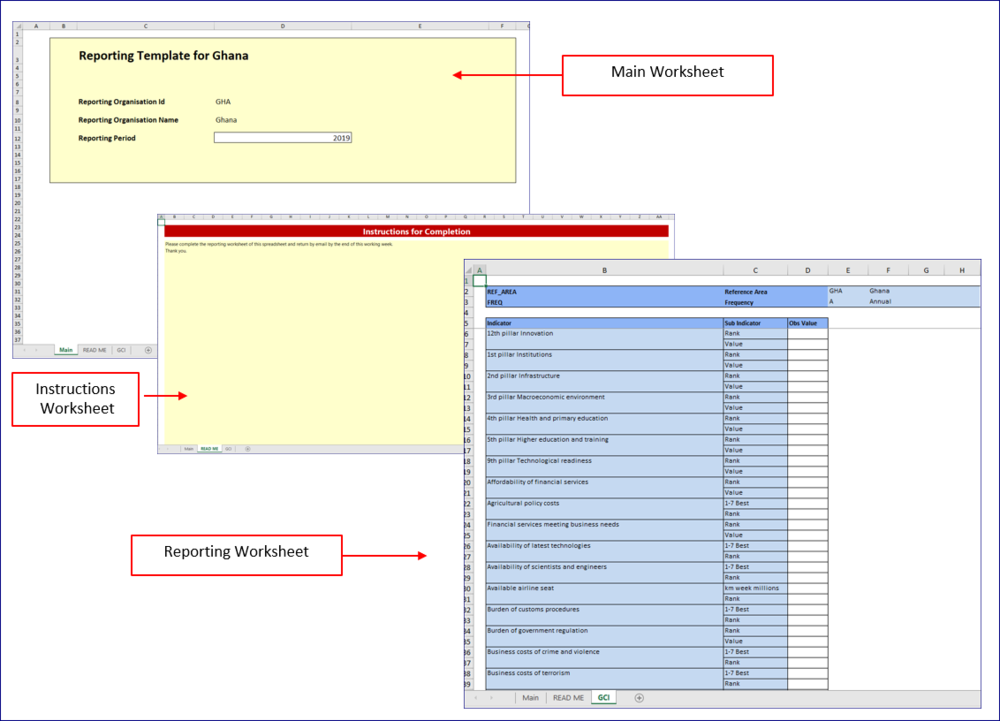
You will note that the Data Provider GHA has been selected, this means that the Constraint attached to the Provision Agreement will be used. The Frequency selected is Annual, so to to report for the whole of 2019, that year is placed on both the From and To dates. Click Generate when done.
The resulting Spreadsheet can be opened from the downloaded file.
In this example, the recipient would read the Instruction worksheet (which has been named READ ME) fill in the observational data and then save and return the completed spreadsheet to the sender.
As stated above, this is a very simple example. You can read more about Reporting Templates in this article.


